
- Setting up Auditing & Logging of Files/Objects Using Native Windows File Server Tools - 16th October 2020
- Designing Key Performance Indicators (KPI) - 15th July 2020
- DDOS Attacks and Website Hacking - 6th July 2020
This is a tutorial on how to setup monitoring and logging on a Debian Linux EC2 instance running a web server using Apache using AWS CloudWatch. CloudWatch does not provide disk (i.e. storage) and memory (i.e. RAM) utilisation metrics within it’s standards AWS CloudWatch options. For this, custom monitoring will have to be used through the AWS CloudWatch Agent running on the EC2 instances. In this tutorial, I will describe a process that I believe is more efficient than the ones described in the AWS manual, my recommendations on the configuration of the server side agent, CloudWatch metrics, dashboards and alarms, and some of the nuances to account for when designing the setup that the AWS manual does not cover that otherwise would cause the setup to fail. This tutorial is written for people already somewhat familiar with AWS, the AWS console and Linux, and so does not go into great detail on the concepts of monitoring and logging or very detailed steps such as menu locations and item names.
Broadly, the steps we will be carrying out are:
- Setup permissions for EC2 instance to send metrics and log files to CloudWatch
- Install and configure CloudWatch agent for monitoring
- Configure CloudWatch agent for logging
Notes
Before we being, a few things to note and take into consideration.
AWS Documentation Errors – Which Agent to Install
The AWS manuals for installing the agent only specify options for AMD and ARM based server architecture. However, AWS documentation also states that the T2 series of EC2 servers run on Intel Xeon architecture. Nevertheless, you can use the AMD based agent for T2 servers as this will, surprisingly, work on Intel architecture.
Run the Agent as Root
In case the configuration wizard (described below) asks you which user to run the agent as, I recommend running the agent as the root user in the configuration (if the configuration wizard does not ask you which user to run the agent as, then it will automatically be running as root). Although running it as another user, such as a default user the agent creates during it’s installation, will work for monitoring metrics, I have found that that user is not able to successfully send the log files to CloudWatch. However, running the agent as root does work for both monitoring and log files.
Do Not Use Scripts
AWS has deprecated all of the scripts it previously recommended and provided for monitoring servers. The scripts have been replaced by the Agent and this is now AWS’s preferred method for server based monitoring.
Always Set a Retention Period for the Logs
By default, AWS will set the log’s retention period in CloudWatch to never expire. AWS provides 5 GB of log retention for free. Not withstanding a desire to keep within this limit, it is never a good idea to keep logs indefinitely. Rather, always set a period of log retention. This can easily be done through the CloudWatch console and there is no need to repeat the procedure here.
Step 1: Setup and IAM Role to Enable Permissions for the EC2 Instance to Write to CloudWatch
Setting up IAM roles is fairly straightforward and the steps to do so are described in the AWS manual on IAM, so I will not repeat them here. My approach is as follows:
- Create an IAM role using the standard procedure in the AWS manual
- Assign the following, prebuilt, policy to the role – you do not have to create a custom policy as AWS has one for the CloudWatch Agent already:
CloudWatchAgentServerPolicy - Assign the policy from within the Console to the EC2 instances. This can be automated via a Terraform or Puppet script for server orchestration in large enterprises. However, for smaller organisations that is unnecessary and simply using the console to assign the role to the instances will suffice.
Step 2: Install and Configure the CloudWatch Agent onto the EC2 Instance
Download the agent:
|
1 |
sudo wget https://s3.amazonaws.com/amazoncloudwatch-agent/ubuntu/amd64/latest/amazon-cloudwatch-agent.deb |
Optionally, you may want to verify the signatures of the download. This is not critical to the success of the installation, but is a recommended step to carry out, if possible.
Install the downloaded package:
|
1 |
sudo dpkg -i -E ./amazon-cloudwatch-agent.deb |
NOTE: Do not start the agent yet.
Configure the agent using the agent configuration wizard. The Agent uses a json file to hold all it’s configurations, and although this can be created by hand it is far easier and quicker to run through the wizard. This tutorial assumes that the AWS CLI has already been installed on the server and thus the access keys have been setup. If not, then the CLI can be setup by following the steps stated in my tutorial for setting up a web server.
|
1 |
sudo /opt/aws/amazon-cloudwatch-agent/bin/amazon-cloudwatch-agent-config-wizard |
The wizard will walk you through various configuration options. My recommended configuration settings, balancing both costs and operational needs are:
- Detail Level of metrics configuration: Basic – this will provide memory and disk utilisation statistics
- Turn off
statsd - Turn off
collectd - Yes to monitoring CPU, memory, etc.
- Yes to monitoring cpu metrics per core
- Add dimensions
- Keep monitoring resolutions to 60 seconds (the default)
- Exclude any prior existing CloudWatch log agent – select no to import any config file
- Decline monitoring any log files for the moment. We will first test and setup CloudWatch monitoring and then later on in this tutorial setup logging.
- Decline storing the config in the SSM parameter store. You can do so, but for the purposes of smaller IT estates and this tutorial, I am recommending not to do so.
Once the wizard has completed, it will output a message confirming that it has completed and the location where is has saved the config file. Make a note of this location as we will need it in the next step to start the agent.
Start the agent by entering the following command. The command for the agent requires the location of the config file. Thus, replace the configuration-file-path in the command below with the path to the config file noted above:
|
1 |
sudo /opt/aws/amazon-cloudwatch-agent/bin/amazon-cloudwatch-agent-ctl -a fetch-config -m ec2 -s -c file:<enter configuration-file-path> |
Step 3: Setup Monitoring and Alerts in CloudWatch
Wait for about 10 minutes for the monitoring data to be sent over to CloudWatch, although sometimes the sending of the data is nearly instantaneous and you can attempt to see if the monitoring data is flowing immediately after starting the agent.
Monitoring Dashboard
The actual creation of the dashboard is simple and self explanatory so I won’t go into the detailed steps here. Rather, I will provide a view into how I setup my monitoring dashboard and a view that I think is beneficial:
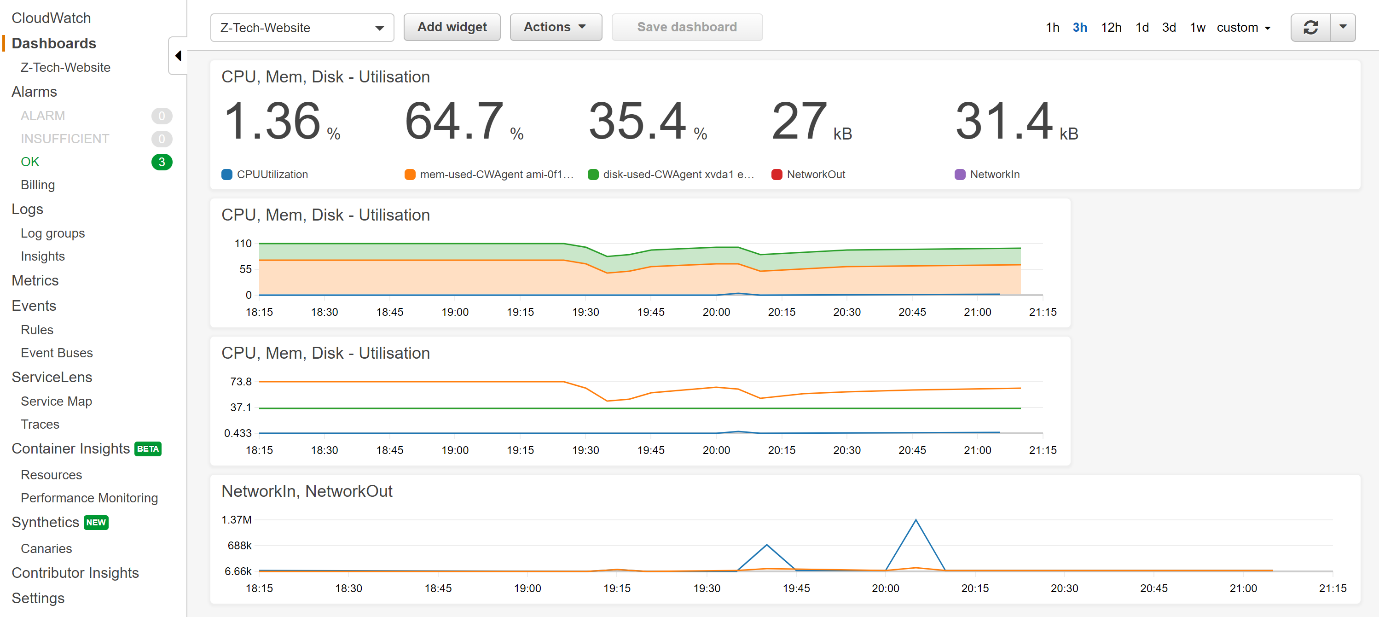
CloudWatch Dashboard
As you can see, I prefer to keep a simple, high level view of the estate for the dashboard (it is a dashboard after all). If there are any discrepancies shown, or if the alerts highlight something, then logs can be investigated. But for the dashboard in general, I prefer including minimal but critical metrics, such as the following:
- Metrics for CPU, memory and disk utilisation, and
NetworkInandNetworkOuttraffic with actual numbers - An area gragh of CPU, memory and disk utilisation because sometimes a line graph is not as easy as an area graph to read for identifying any odd spikes or other anomalies
- A line graph of CPU, memory and disk utilisation because sometimes an area graph is not as easy as a line graph for identifying any odd spikes or other anomalies
- A
NetworkInandNetworkout line graph to see if there are any anomalies
Alarms
Alarms are critical for running any form of technology product or service as they will alert you when anything untoward happens based on a pre-determined set of criteria that you have configured. The minimum alarms I prefer keeping, for a server, which I believe are critical and essential and should be set for all systems are as follows.
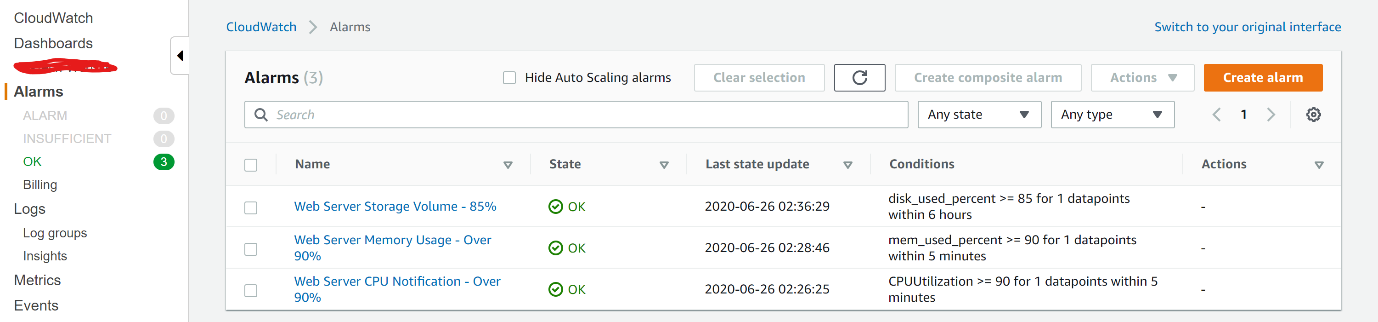
CloudWatch Alerts
As you can see above:
- Disk/volume utilisation – to ensure that we are notified when we are running out of storage space – alarm set at 85%. Please note:
- AWS when setting up the alarms and monitoring will provide the option for all storage volumes attached to the instance. My recommendation is to limit the monitoring and alarms to only those volumes where the OS resides (usually called
dev1) and any other volume used to store app data - I prefer to keep a storage capacity alarm at 85% or lower (i.e. lower than the CPU or memory thresholds), depending on the application and its storage utilisation. This is because we usually need more time to provision storage for reasons such as creating backups or calculating the optimum amount of additional storage to required, and setting a lower alarm threshold gives us more time till when the storage capacity if reached for carrying out those calculations. Usually, provisioning another EC2 instance to balance the load of memory or CPU utilisation using a pre-configured AMI, is part of the overall solution architecture and can be done quickly. But storage, in my experience, has more preconditions that need to be taken account of before provisioning additional capacity, hence, why I recommend giving more ourselves more time to carry out those calculations by setting a lower alarm threshold.
- AWS when setting up the alarms and monitoring will provide the option for all storage volumes attached to the instance. My recommendation is to limit the monitoring and alarms to only those volumes where the OS resides (usually called
- Memory usage – to ensure that we are notified when something is causing our server to run out of memory – set at 90%
- CPU usage – to ensure that we are notified when something causes our CPU to run out of processing capacity – set at 90%.
Step 4: Configure Logging on the Server
Now that monitoring has been enabled and tested to be working successfully, it’s time to enable logging using the CloudWatch agent on the servers. The Agent will be configured to collect logs and send them to CloudWatch for ingestion. Please note, that most Linux Operating Systems (OS) have log file management (i.e. rotation) enabled by default on the server using the logrotate utility – if this is not enabled already, it would be a good opportunity to enable it now.
For logging to work, we simply have to run the config wizard again, with the same config as set above, but when it asks you to confirm if there are logs to monitor, then select ‘yes’ instead of ‘no’. The wizard will ask you to provide the location of the logs, which in most Linux OS’s is /var/log/<system name e.g. apache2>/<log file name e.g. error.log>. You can keep all the other config options at their default settings.
Once this has been done, it is important to restart the agent – this is critical to get the agent to pick up the new config file as if it is not restarted it will continue to use the old one:
|
1 |
sudo /opt/aws/amazon-cloudwatch-agent/bin/amazon-cloudwatch-agent-ctl -a fetch-config -m ec2 -s -c file:<enter configuration-file-path> |
If the system is a web server that the monitoring is being setup for, I find that it is best to restart the web engine, too, like apache or nginx, for the server and agent to pickup the logs and send them to CloudWatch. If, when you check in CloudWatch and cannot see the new log files, or cannot see new entries, it’s usually an agent and web engine issue that can easily be solved by restarting both.
You can test that the logging is working successfully by going to the Log Groups section of CloudWatch and viewing the logs there.
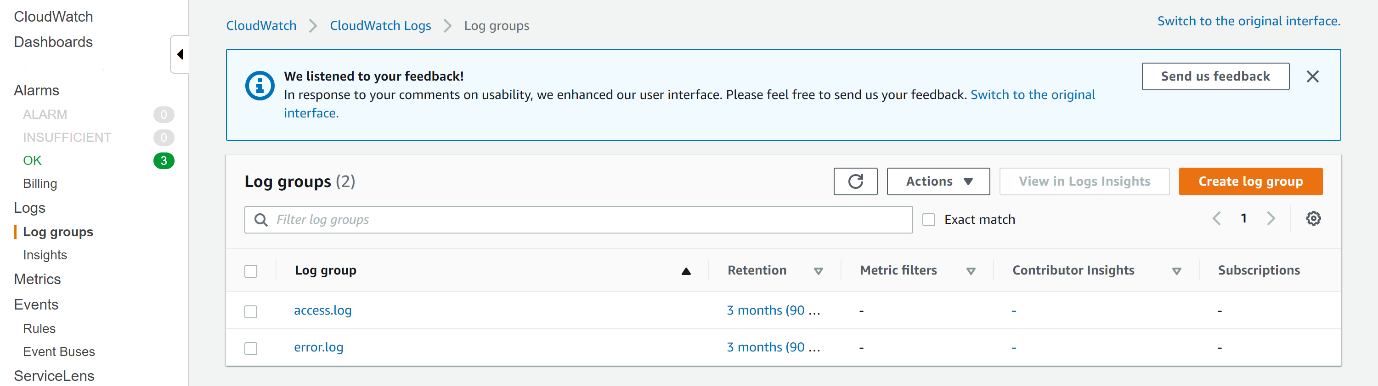
Cloud Watch Logging
Related posts:
Z Tech Blog
Z Tech is a technologist, senior programme director, business change lead and Agile methodology specialist. He is a former solutions architect, software engineer, infrastructure engineer and cyber security manager. He writes here in his spare time about technology, tech driven business change, how best to adopt Agile practices and cyber security.
Pingback: DDOS Attacks and Website Hacking - Responding to Attacks and Unauthorised Access Attempts